As we trudge into the sixth week of the lockdown and agonisingly stare at the catastrophe wrecked by the contagion even on the mighty nations, we cannot help but be besieged by gnawing anxiety, as to when this nightmare would be over. Did the lockdown have desired effect? Has the growth curve of infections been flattened? Are we likely to get out of the lockdown soon? Will the Indian heat and humidity impede the virulence of the disease? There are vexing questions galore. But the most pressing, is the concern, as to whether there will be a second wave or a resurgence of the virus in India once the containment is softened? After all, even Singapore is witnessing a sharp resurgence now.
To add to the conundrum there are conflicting reports, which forecast the pandemic to end in India in May 2020 itself, while some paint a doomsday picture of over 4.5 lakh infections by May end. To understand as to what lies ahead, let's briefly recapitulate the ground reality five weeks ago.
On the 25th of March when the lockdown commenced, India had just 657 positive cases. But the preceding ‘average per day rate of growth’, was above 20%, implying, quadrupling of the disease in just seven days. Thus, at this unabated exponential rate, infections in the next five weeks could have theoretically multiplied over 1000 times and reached nearly 6.5 lakhs. Presently, the disease count is at 37,262 (on 1st of May) and the daily growth rate has plummeted to nearly 6.87%. At this rate the infection would double in nearly 11 days. The most positive outcome is the dwindling of death rate in ‘closed cases’ to approximately 10.88% from an earlier high of nearly 27.38 %. ( data source: covid19india.org)
Thus, as a country, we are shortly to reach the stage of the ‘flattening of the curve’. This is said to happen when the daily rate of growth falls even below 5%. Eventually begins the ‘healing phase’, when the daily recoveries are equal to or more than the new infections, with latter also showing a declining trend. The fall of the growth rate to 6.87%, is comforting but not sufficient. Other countries in similar lockdown have been able to attain a lower growth of even 2% to 3 % ( viz South Korea, Germany, Japan )
A state of States:
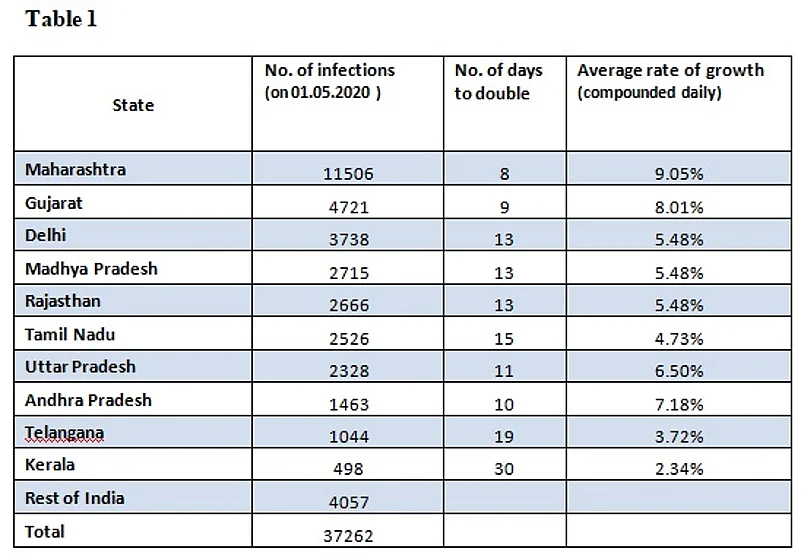
Meanwhile, the various states of India are on disparate growth trajectories. Maharashtra (11,506 infections) and Gujarat (4,721) have the highest number of positive cases. (data as on 01.05.2020; source covid19india.org) Further, they have the dual challenge of facing the highest rate of growth, with the current doubling of infections taking place in just eight days and nine days respectively (see table 1). Delhi, Madhya Pradesh and Rajasthan, which are next in absolute number terms, have doubled in the last 13 days. But Uttar Pradesh and Andhra Pradesh, which have a lesser number of infections, have a higher rate of growth with positive cases doubling in just 11 and 10 days respectively.

Kerala can truly be said to have flattened the curve. Now it has just 498 infections with only 102 active cases and an ambling doubling time of 30 days. Further, the number of new infections are equal or below the daily recoveries, a true indicator of being in the ‘healing phase.
Five states and union territories have remained completely Covid free. At a more micro level, over 319 districts (out of 733) were unaffected by the pandemic or do not have a single new case in last 21 days (categorised as green zones). 284 districts are categorised as orange zones and 130 districts are categorise red zones which may have further containment zones.( figures as on 01.05. 2020)
Projections for May 2020:
Clearly, with varying trajectories of states in this phase of the pandemic, any national projection is not simple. What is certain is that the country is to remain in a ‘complete lockdown’ till the 3rd of May and “conditional lockdown” till 17th of May (as per the announcement of further lockdown on 01.05.2020). Thus, there is a partial lifting of restrictions in different zones in the next phase of lockdown. Therefore, one can expect a further fall in the rate of growth of infections. As the latency period (of exposure, the appearance of symptoms, testing and statistical reporting) is nearly 10 days, we can expect the rate of growth, to gradually fall till around May 13, from the current 6.87% to nearly 3.5%. A more optimistic scenario could be, to hope the growth to fall even further, to about 2%. But indeed the most pertinent question is, what is going to be the scenario beyond this period?
The prognosis:
With the buffers of essential goods and services depleting, there was a socio-economic need for restoring their supply chains and of their ancillary support. This meant softening of the containments to a certain degree, particularly for the states and districts with no or very low disease incidence. The need for resuming those agricultural, manufacturing and construction activities, which could restore the livelihood of the daily bread earners and provide succour to other vulnerable sections, was imperative too. This has well been encapsulated in the 3rd ‘conditional lockdown’ till 17th May (announced on 01.05.2020). Thus, the level of human activity and engagement would surely undergo an increase. Despite the best efforts and new protocols of physical distancing at the workplace and society, the rise in infection is likely. The only question is how rapid it could be.
The easing of lock-down is more in green and orange zones, while the current hot spots continue to be in strict containment. Therefore, we may expect the initial rate of rising of infection to be slow. There is a good likelihood that this rise in a region may well be counterbalanced by a decline in growth rate in other states and regions, thus somewhat tempering the Covid growth trajectory. As such the infection growth rate would be an aggregate of different ‘waxing and waning’ regions on disparate trajectories.
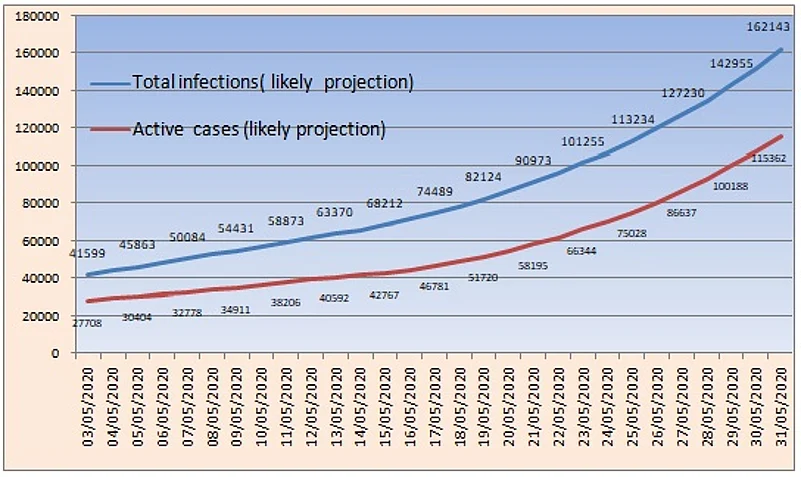
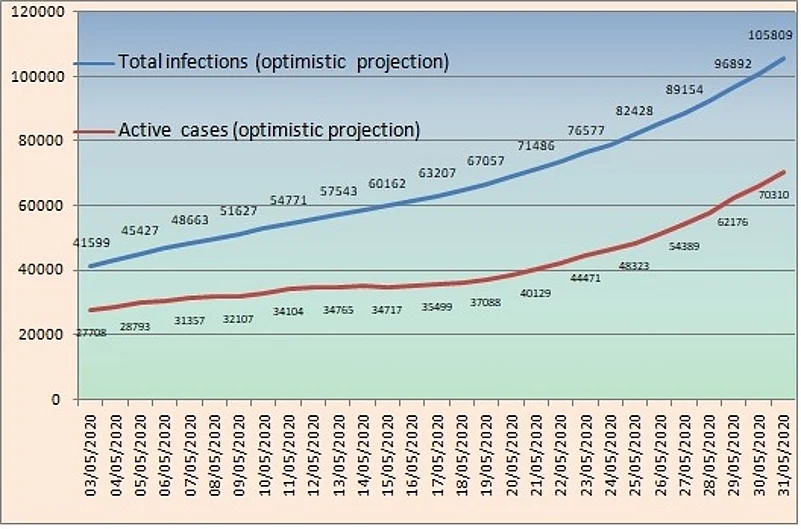
We can expect this phase of ‘creeping increase’ to begin from the 15th of May which may see a rise in rate of spread by further 2% to 3% by the month-end. Based on the trajectories a likely projection (graph 1) and optimistic projection (graph 2) is broadly indicated below.
A likely projection of infections in May 2020 (Graph 1)

By the 31st of May (likely outcome), we may see the growth of infections to 1.62 lakh with nearly 1.15 lakh active cases. In more optimistic modelling, the positive cases may limit to 1.05 lakh and active cases may fall to just around 70,310.
An optimistic projection of infections in May 2020 (Graph 2)

The next wave:
Come June, the situation would be more fluid and even tentative. As the economic and human resilience wears, the clamour for loosening the remaining vestiges of containments could become more shrill and even imperative. Restoring the national and inter-state transportation and other such services to their fullness, may become an abject necessity. And then the contagion may see a resurgence. A rise of infection in multiple regions may not be set off by decline in others, resulting in a sharp increase overall. The worsening situation may call for stricter containment in specific or larger hotspots, thereby then cooling the growth rate. This would be a ‘pulsating phase’ of the pandemic with multiple periods of rise and fall.
The ‘gradual ebbing’ or a ‘creeping rise’ in this ‘next wave’ would largely depend on the creation of fresh protocols of human interaction and evolving ‘new normals’ for our work. The heat and humidity may or may not turn out to be our ally but ‘physical distancing’ and ‘personal hygiene’ would surely be our primary defence. This wave may persist for months, till any vaccine is developed or the population acquires ‘herd immunity’.
But to brace for the next wave, presently we need to reboot our factories, re-plough our fields and reaffirm our belief in our fortitude and resilience.We may remember as well, that tough times never last, but tough people do.
(The author is an IRS officer. He has a degree in mechanical engineering, law and masters degree in economics. He is also associated as an expert panellist on information security with APRG+ group, of Global Forum , OECD. The statistical projections are based on current trends. Views expressed are personal.)


